The Problem with EIA Shale Gas and Tight Oil Forecasts
April 4, 2018
 Chris Waits, Flickr https://www.flickr.com/
Each year the U.S. Energy Information Administration (EIA) produces forecasts of U.S. oil and gas production in its Annual Energy Outlook (AEO), which is widely viewed as an authoritative assessment of what to expect for future U.S. oil and gas output (the EIA prefers the term “projection” to “forecast”). The EIA’s reference case is considered as the most likely scenario by industry, policy makers, and the media.
Considering that AEO reference case forecasts for shale gas and tight oil production in recent releases are remarkably optimistic when considered at the play-level in terms of well productivity, decline rates and prospective areas, I find this baffling and worrisome. It’s one thing for industry to paint a rosy picture of future production, but something altogether different when a government agency—tasked with providing the American public with objective information—does it.
AEO2018, for example, projects that shale gas production will be 130% higher in 2050 than in 2016, while tight oil production will grow by 74%, all at relatively low prices. This despite the fact that average production from individual wells falls 70–90% in the first three years and entire fields would decline 20-40% a year if new wells weren’t constantly drilled.
I recently assessed the EIA’s AEO2017 forecasts and assumptions for all major shale gas and tight oil plays using a proprietary commercial database of well production data—a database that the EIA itself uses for its own analysis. The study revealed that the EIA has overestimated the likely future production of shale gas and tight oil for most plays by a wide margin. This is a result of overestimating the size of the prospective area and hence the number of wells that can be drilled, and underestimating future declines in well productivity. These declines in productivity are due to well interference (as sweet spots become saturated with wells) and from drilling lower quality rock outside of the limited sweet spot areas. The EIA’s estimates are also much higher than those of the U.S. Geological Survey and the University of Texas Bureau of Economic Geology.
If the AEO2018 reference case projections are compared to the EIA’s most recent assumptions of proven reserves plus unproven resources, tight oil production would extract 96% of remaining tight oil and shale gas production would extract 77% of remaining shale gas by 2050, even though unproven resources (which are 86% of remaining potential) have not been demonstrated to be economically recoverable and are based on unrealistically large estimates of productive area for most plays. Furthermore, as the EIA projections assume that production will be at much higher levels in 2050 than today, they imply that there are vastly more additional resources to be recovered after 2050 than suggested by the EIA’s own estimates. Indeed, in several plays the EIA’s projections assume that more than 100% of its estimates of proven reserves plus unproven resources will be recovered before 2050. In essence, the EIA is banking on recovering resources that do not exist according to its current best estimates.
In the weeks following the release of AEO2018, the EIA published a report on the methodology behind its projections. Using the Eagle Ford play as an example, this report provided a reasonable overview of the evolution of shale plays—from discovery to full development to infill drilling of sweet spots and moving on to lower quality rock outside of sweet spots. This part of the report built on an assessment done by the same author in 2014. To my knowledge, the Eagle Ford play is the only county level assessment the EIA has ever published.
The report goes on, however, to dispel any confidence that the Eagle Ford example is actually how the EIA comes up with its projections. The EIA apparently assumes that the estimated ultimate recovery (EUR) of wells will continue to increase for the foreseeable future due to better technology, and that drilling and operating costs will decrease for the foreseeable future, given this table of assumptions of annual changes in costs and EURs from the report:

By overestimating prospective play areas and hence the number of available drilling locations, by assuming well EURs will continue to increase indefinitely, and by assuming drilling and operating costs will continue to fall, the EIA can come up with whatever forecast it wants. This is amply illustrated by the wild fluctuations from year to year in the EIA’s play-level forecasts pointed out in my study (the play-level forecasts are not published in the AEO—they are only provided if a special request is made to the EIA).
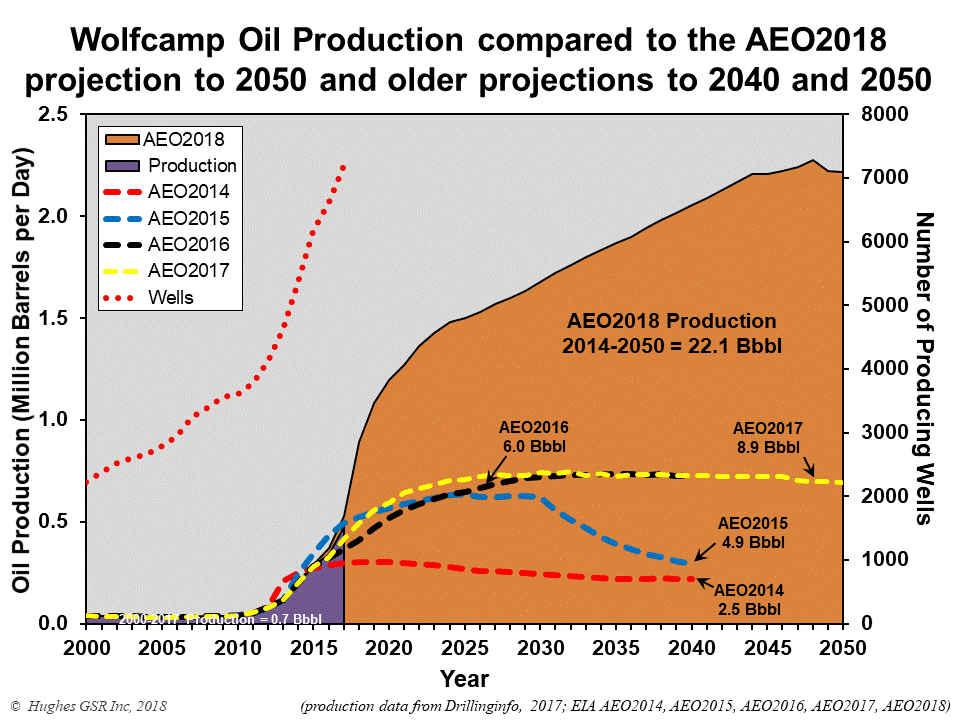
An example from AEO2018 is the Wolfcamp Play in the Permian Basin below. The EIA projects 148% more oil will be recovered in the AEO2018 projection than it projected in AEO2017, just one year earlier (22.1 billion barrels recovered by 2050 in AEO2018 compared to 8.9 billion barrels in AEO2017). This is 87% more oil than the total of Wolfcamp proven reserves plus unproven resources that the EIA estimated in 2017 (11.8 billion barrels).

How can this be? Most major shale plays have now been extensively drilled so the dimensions of the plays and location of sweet spots are well known. Over 400,000 wells have been drilled in the Permian Basin over many decades. Geology doesn’t change year to year and technology doesn’t improve at those rates over a single year (in fact average well productivity in 2017 declined in the Wolfcamp—see Figure 48).
Given an analysis of play fundamentals based on current drilling data, there is no credible basis for the highly to extremely optimistic forecasts offered by the EIA. Actual production is likely to be far less. Assuming the EIA forecasts are accurate in a long-term energy plan is likely to end very badly. And yet these forecasts are uncritically accepted by policy makers and the media, the consequences of which will be borne by all of us.
