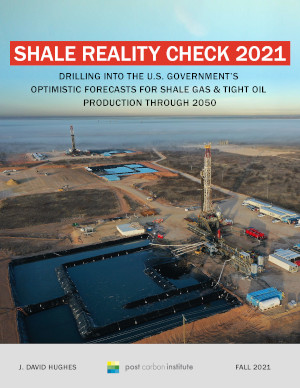
Shale Reality Check 2021
December 8, 2021
Shale gas and tight oil have provided a new lease on life for U.S. oil and gas production. But how sustainable is shale production in the long term given optimistic forecasts of robust production through 2050 and beyond?
In Shale Reality Check 2021: Drilling Into the U.S. Government’s Optimistic Forecasts for Shale Gas & Tight Oil Production Through 2050, earth scientist J. David Hughes assesses the viability of the U.S. Energy Information Administration’s (EIA) shale forecasts in its Annual Energy Outlook 2021, which are widely used by policymakers, industry, and investors to make long-term plans. His detailed analysis finds that the EIA’s forecasts of tight oil and shale gas production through 2050 “highly to extremely optimistic.”
About this report
Given that shale plays are forecast to provide a major share of U.S. domestic oil and gas production through 2050, it is crucial for future planning and policy development to understand their long-term viability and the reliability of long-term forecasts. This report assesses the credibility of EIA forecasts of future shale production on a play-by-play basis in terms of likelihood of meeting forecast production levels and what it would take to meet them in terms of new wells drilled and capital investment. The report is based on an analysis of well production data for all major shale gas and tight oil plays in the U.S. These plays make up 87% of the EIA’s Annual Energy Outlook 2021 (AEO2021) reference case production forecast of tight oil and 77% of shale gas for the period 2020–2050. Along with references from the literature, the key data source is Enverus, a commercial database of well-level production data which is utilized by the EIA and most major oil and gas companies.
For each play, this report assesses:
- Current and historical production, and cumulative oil and gas production by county.
- Total- and producing-well count by county, well type, and vintage.
- Three-year well decline and first-year field decline by county, well type, and vintage.
- Distribution of wells in terms of quality, as defined by production of oil or gas in the highest month (initial productivity), in order to delineate sweet spots.
- Average productivity of all wells drilled in each year from 2012 to 2021 by county, well type, and play, in order to assess the impact of improved technology.
- Projected number of wells, well density, and capital investment required to meet production forecasts.
- Comparison of forecast production to EIA estimates of proven reserves plus unproven resources.
- The optimism bias for the EIA AEO2021 play-level forecasts based on play fundamentals determined from the assessment.
See previous reports in this 10-year series at shalebubble.org.
In the news
- New Report Throws Doubt on Overly Optimistic Fracking Forecasts From U.S. Government, DeSmogBlog, December 8, 2021
- Has The EIA Massively Overestimated The Potential Of U.S. Shale?, OilPrice.com, December 8, 2021
Errata
- Executive Summary, page xiii, Table ES1: “Total of all plays” under column “Oil” should be 7.31.
